5 Data Analysis Techniques That Can Surprise You

As a smart data scientist, you need an in-depth understanding of a few data analysis techniques as easy to reach tricks up your sleeve. You should take the time to learn all aspects of at least five data analysis methodology and have a general idea of as many other methods as you possibly could comprehend.
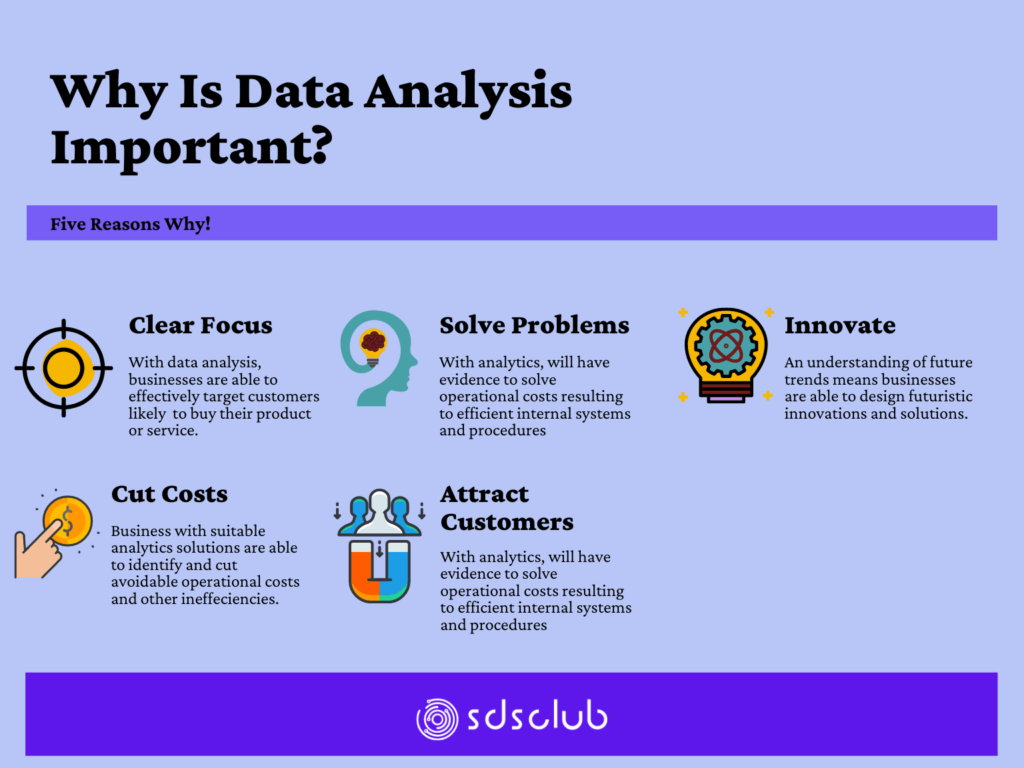
But this begs the question, why is data analysis important? Why take the time to learn about analytics? Data analysis is essential because it provides a means through which businesses and other institutions gather and analyze evidence for decision-making.
So, if ever you pondered on data analysis concepts and how to analyze data, read along!
The first step in your analysis is categorizing the data before you, according to two main data analysis methods:
● Quantitative Data Analysis Methods
Quantitative data sets are expressed in numerical form. The data is typically in two structures, continuous and discrete. Discrete numbers are finite integers arrived by counting; for example, the number of pigs in a farm can be 4 or 20 but never 4.5 pigs. The result of quantitative data analysis methods is a visual representation of the data, usually in tables and graphs.
On the other hand, continuous data sets represent a scale of measurement and can be in infinite forms as it can take any value, including integers, fractions, and decimals.
Quantitative data is mostly applicable in mathematical calculations and statistical analysis, mainly used to rank problems, answering the question ‘How many?’ ‘How often’ and ‘How much.’
● Qualitative Data Analysis Methods
The data analysis strategy, as the name implies, is mostly applicable to qualitative data. Qualitative data lends itself to descriptors that cannot be easily measured but subjectively observed, such as color, tastes, beauty, smells, textures, etc. Qualitative data sets are created when you classify or judge the qualities of a phenomenon.
The data is in three forms binary, nominal, or ordinal data sets. Binary categorizes concepts in ‘right or wrong,’ ‘true or false,’ ‘accept or reject,’ ‘male or female,’ among other forms.
Nominal data is used for labeling data without a quantitative value, while ordinal data is categorical data with an order to it, such as short, medium, and tall. Survey data that asks people to rate on a scale of 1 to 10 are also ordinal.
Top 5 Types of Data Analysis Methods
1. Text Analysis
If you’re thinking through how to analyze qualitative data, text analysis techniques may be of use. When buying a product from Amazon, most consumers scroll down to the review section; and find that they can read reviews that mention a particular keyword or set of keywords. For instance, when buying body oil, a customer can filter and only read reviews that mention ‘dry skin,’ ‘sensitive skin,’ and other keywords.
As seen from the example, text analysis is a machine learning technique that enables big corporate companies to extract and classify text data such as product reviews, survey responses, tweets, emails, and support tickets.
Pro and Con of Text Data Analysis
Text analysis softwares will save you time and money. There are numerous free and premium qualitative data analysis softwares available for use. You can use text analysis to create an AI assistant that answers questions to new users who visit your website, for instance. However, a common disadvantage of text analysis is that it may yield results without context, which may be misleading to a user who is not keen to investigate and find out details of a query.
2. Statistical Analysis
You can use statistical data analysis techniques to discover the nature of data and its relationship with other data sets. For instance, with data analysis and interpretations of statistical data from a sample population, you can draw conclusions about a whole region.
The analysis involves gathering and evaluating data, then providing mathematical summaries of the data. Examples of statistical data analysis techniques include: –
- Mean
- Regression analysis
- Skewness
- Kurtosis
- Variance
Pros and Con of Statistical Data Analysis
The main advantage of statistical data analysis is that it is easy to draw patterns and correlations from the data. Furthermore, the statistical analysis makes it easy to generalize findings from a sample population to a broader population when applied correctly.
However, a major con is that it is easy for researchers to manipulate the data as evidence to justify a biased perspective. Due to the ease of generalizing statistical data, it is easy for an analyst to make conclusions without proper causation or objectivity.
3. Descriptive Analysis
Descriptive analytics is usually in the form of Exploratory Descriptive Analytics or Focused Descriptive Analytics. The data analysis method uses historical data and answers the what, where, and how questions but not why questions. Exploratory analytics gives insights, variations, relationships, and patterns useful for building predictive and prescriptive analysis models.
Focused Descriptive Analytics answers direct business questions such as what are the totals sales for the last month? What is the performance of sales representatives in region X? Such answers are only available through querying historical data.
Pros and Cons of Descriptive Analysis
With the focus on historical data through predictive analytics, you’ll always be able to draw invaluable insights from the data. From the rate of growth per period or decline, for example, and compare the findings across other variables. However, a significant disadvantage is that descriptive analytics can only study the relationships between two or three variables at a time.
4. Predictive Analysis
Predictive methods of analysing data apply statistical algorithms and machine learning on current data to identify likely future outcomes. Predictive analytics is mostly used in:
- Fraud Detection: Integrating multiple analysis techniques to increase the chances of detecting patterns that are likely criminal behavior.
- Marketing Campaigns Optimization: Predictive analytics can position a business to identify new markets, attract and retain profitable customers.
- Streamlining Operations: Companies such as hotels and airlines use predictive analytics to determine ticket prices or hotel booking and reservation prices. The method can also be applied to manage resources and forecast inventory.
- Risk Assessment: A business can apply credit scores arrived by analyzing a buyer’s data to determine their likelihood of settling extended credit. Similarly, Credit Bureaus use predictive analytics to assign a credit score to individuals.
Pro and Con of Predictive Analytics
For corporations using predictive analytics, a business can understand the customers’ and potential customers’ needs and products they’re likely to buy. The inherent challenge with predictive analytics is a mere overview of likely future trends is not actionable.
5. Prescriptive Analysis
Predictive methods of data analysis combine insights drawn from all analytics techniques to prescribe the best course of action and possible implications or outcomes.
Pros and Cons of Prescriptive Analysis once
Prescriptive analytics overcomes the limitation of predictive analysis in that it yields actionable, evidence-based insights. A possible shortcoming of prescriptive analytics is that it only applies to situations where the number of operations is too many for a human to analyze. Therefore, while powerful, such analytics methods are solely a preserve of big businesses that generate big data.
Tips Useful for Data Analysis and Interpretations
When analyzing your data, apply the following tips:
- Disaggregate the data: Have you disaggregated the data across gender, age, marital status, ethnicity, and other relevant subgroups?
- Look out for possible trends and themes: What trends are evident in the data over a specific period or season? Are there any recurring themes you notice in the data or subgroups? Are the number of transactions increasing or decreasing over time? What are the underlying factors responsible for the increase or decrease of transactions? Are there trends specific to a subgroup?
- Viable patterns: What patterns is the data revealing about your consumer base? What do the patterns suggest?
- Outliers: What is outstanding or unique about a particular data point or subgroup? Do the outliers indicate a significant meaning or insight concerning the phenomenon being studied? Is the outlier an indication of an error in the data analysis process?
- Contracts and comparisons: What are the likely parallels to be drawn across the available data sets? What are the possible explanations for such differences? Does the difference reveal underlying challenges or strengths across a department, for example?
In your analysis, the answers you get from the above questions will give answers and insights on various aspects of the institution you support.
Final Thoughts
There are numerous other data analysis techniques. So, invest some time to understand two or three methods useful for analyzing qualitative or quantitative data. You will also want to be aware of each’s pros and cons so that you can leverage the strength of a strategy and mitigate its weakness.
Please subscribe to our newsletter for more data analysis information, tips, and tricks.