7 Mistakes to Avoid Using Graphviz Python Tool for Graphs Visualization

The kinds of tools that allow for graphical visualization have become an integral part of Python especially because these tools allow us to perform operations such as visualizing the pattern of a data set, checking for anomalies with a data set or even just checking to see if data is missing. Matplotlib, Seaborn, etc. are some of the popular tools used for data visualization. These popular tools, however, come with certain limitations as they usually do not allow edges and nodes that help connect different graphs. Hence the reason many developers are leaning towards Graphviz as it does not have any of those limitations. Yet, while using Python Graphviz for graphs visualization can be very convenient, it is always easy to make certain mistakes. We will now consider 7 mistakes you can make while using this tool. But before we do, let us first understand what Graphviz is.
What is Graphviz
Graphviz, which is a short form of Graph Visualization Software, is an open-source module that is based on the DOT language. It has now become an essential tool when it comes to data visualization and allows us the luxury of depicting and illustrating structural information in the form of abstract graphs and networks. Meaning that we can either represent data graphically or using command-line. Developers usually use Graphviz Python to visualize graph Python because it offers them one unique advantage over other visualization tools: the ability to connect several graphs by creating nodes and edges.
To have an even better understanding of Graphviz, think of several circles, or several boxes with words contained in them. Then think of those boxes or circles connected to each with lines in such a way that the whole picture makes perfect sense. Because this is precisely what Graphviz is: a simple picture bearing circles or boxes joined by lines. The boxes or circles are what we call nodes and the lines are what we call edges.
When learning how to use Graphviz, it is important to note that this tool contains several programs and libraries including utility programs such as dot, neato, and twopi, graphical programs such as dotty, tcldot, lefty, and drawing libraries such libgraph and libagraph.
Pros and Cons of Graphviz
Like all things, Graphviz also has its advantages and disadvantages and we will be looking at a few of each.
Pros
- It is an open-source software which makes it easy to access and use
- Graphviz is not only free but also easy to use
- It offers several packages and libraries including those for utility, graphics, and drawing
- It has an interactive graphical interface that is also web-based
- It is based on the DOT language and also offers extra auxiliary tools
Cons
- It comes with a highly unorganized learning documentation
- There is not a lot of helpful support from the community
- Graphviz does not support Geospatial use. It also does not support TimeBar
- It does not support GUI editors and hence impossible to use in that regards
Installation and How to Use Graphviz
To see how Graphviz helps Python visualize graph let us first learn how to install Graphviz in Python. The straightforward process can usually be done by either downloading the Graphviz source code directly from their website or by importing it from whatever package manager you have installed on your system.
To install Graphviz Python windows version, we use the line of code below to install Graphviz:
$ pip install graphvizTo begin creating graphs, we need to import the Digraph tool:
>>> from graphviz import Digraph
>>> dot = Digraph(comment='The Round Table')
>>> dot  #doctest: +ELLIPSIS
<graphviz.dot.Digraph object at 0x...>
Once we have imported the Digraph we can start adding nodes and edges like in the lines of code below:
>>> dot.node('A', 'King Arthur')
>>> dot.node('B', 'Sir Bedevere the Wise')
>>> dot.node('L', 'Sir Lancelot the Brave')
>>> dot.edges(['AB', 'AL'])
>>> dot.edge('B', 'L', constraint='false')
Next we can check with the lines of code below to be sure we have just generated the correct source code:
>>> print(dot.source)  # doctest: +NORMALIZE_WHITESPACE
// The Round Table
digraph {
    A [label="King Arthur"]
    B [label="Sir Bedevere the Wise"]
    L [label="Sir Lancelot the Brave"]
    A -> B
    A -> L
    B -> L [constraint=false]
}
We may then use the code below to both save and render the source code:
>>> dot.render('test-output/round-table.gv', view=True)  # doctest: +SKIP
'test-output/round-table.gv.pdf'
The final output to everything we have done above would look like the graph below:

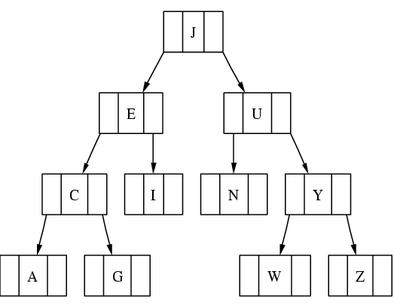
As part of our Graphviz Python tutorial, let us also see how to use Graphviz to create a family tree. Usually, a family tree is considered as ordered if the following statements hold true:
- If each son of the first box or circle can be identified as a left child and a right child
- If each first right and left sons can have at most one right child and one left child themselves
We can use the dot source code below to create a Python visualize tree:
digraph G
{
        node [shape = record];

        node0 [ label ="<f0> | <f1> J | <f2> "];
        node1 [ label ="<f0> | <f1> E | <f2> "];
        node4 [ label ="<f0> | <f1> C | <f2> "];
        node6 [ label ="<f0> | <f1> I | <f2> "];
        node2 [ label ="<f0> | <f1> U | <f2> "];
        node5 [ label ="<f0> | <f1> N | <f2> "];
        node9 [ label ="<f0> | <f1> Y | <f2> "];
        node8 [ label ="<f0> | <f1> W | <f2> "];
        node10 [ label ="<f0> | <f1> Z | <f2> "];
        node7 [ label ="<f0> | <f1> A | <f2> "];
        node3 [ label ="<f0> | <f1> G | <f2> "];


        "node0":f0 -> "node1":f1;
        "node0":f2 -> "node2":f1;

        "node1":f0 -> "node4":f1;
        "node1":f2 -> "node6":f1;
        "node4":f0 -> "node7":f1;
        "node4":f2 -> "node3":f1;

        "node2":f0 -> "node5":f1;
        "node2":f2 -> "node9":f1;

        "node9":f0 -> "node8":f1;
        "node9":f2 -> "node10":f1;
}
The output would be the tree below:
Possible Mistakes and Solutions of Graphviz Python
The following are 7 common mistakes that can be made when using Graphviz and their respective solutions.
- Using the Wrong Attributes to Enlarge Layouts
Attributes like height and width exist in Graphviz and are sometimes erroneously used to increase the layout. However, these do not work.
The solution is always to use the proper types of attributes such as nodesep and ranksep.
2. Embedding Links Inside PDF
Directly including links into PDF is not supported in Graphviz hence links that are directly added end up not being clickable.
To solve this, first create a PostScript with the links added in the final output then, using an external converter, convert the PostScript into a PDF. The links included should now be clickable.
3. Joining Cluster Boxes
Many people try to create edges to connect cluster nodes without paying attention to the version of Graphviz they are working with and it can result in an error.
To address this issue and use properly this visualize graph Python feature, we must first ensure we are using the right version of Graphviz. Keep in mind that this feature is not supported by any version of Graphviz older than 1.7.
4. Trying to Execute a Perl/CGI Script Through Apache
It can sometimes happen that we get an empty output when we try to run a Perl/CGI script through the Apache program. When that happens, it is always easily assumed that the modules are not supported by Apache but that is not true.
To resolve this, we simply close the file descriptor you are using on the temporary dot file first before opening the new dot.
5. Causing Nodes and Edges to Overlap
It is also possible to find nodes and edges overlapping while trying to create data structures. This mistake leaves the entire picture looking clumsy and unintelligible.
The solution is to always apply the overlap attribute before creating the graphs when working with multiple nodes and edges.
6. Returning Errors in Webdot
Those who use Webdot are sometimes confronted with errors such as “Font not found” or text labels missing. These errors are usually due to mistakes on the part of the developer.
The solution is to upgrade to a higher version of Graphviz or installing a fontconfig support.
7. Disorderliness of Nodes
When learning how to use Graphviz, there can be instances where the nodes do not get ordered in the specific manner you intended. This usually occurs when we allow the graph to be acyclic. Nodes then get assigned disorderly to ranks and levels.
The solution to this mistake in Graphviz Python is to first create a straight subgraph in the desired length, then make an invisible ordering of the nodes and edges. Finally, assign the main nodes to specific ranks and levels.
Conclusion
Graphviz Python is a very powerful software to use in creating a graphical representation. Once we can move past the common mistakes listed above and others not contained here, it becomes easy to see why the tool is a favorite for developers.
However, if you are yet to learn how to use Graphviz to create data structures and graphs, you may want to first take some of our course before jumping into this. You should also subscribe to our email newsletter so you get directly notified the next time we drop another interesting article.