Data Mining and Business Intelligence: How They Work Together
Business Intelligence (BI) and data mining are tremendously valuable to businesses. When brought together, they help companies leverage their data in order to keep a pulse on the constant changes in consumer behavior and preferences. Data mining for business intelligence also enables businesses to make precise predictions about what their consumers want. These predictions help businesses tailor their marketing campaigns, manage their resources and operate more efficiently in order to maintain a profitable consumer base.
While BI and data mining are often used interchangeably, the two concepts play distinct roles in the world of big data analytics. We’ll break down exactly what their roles are, how they are different and how they work in tandem to help businesses operate at a higher level.
What is Business Intelligence?
Data is being collected at shocking speeds every minute of the day across the world. Each year, cloud software marketing firm, DOMO, releases their annual report on how much data is collected each minute and the numbers have continued to grow year over year. According to their 2019 annual report, Americans alone use 4,416,720 GB of internet data every single minute including:
- 188,000,000 emails
- 390,030 app downloads
- 4,497,420 Google searches
- 694,444 hours of video on Neftlix
Businesses not only need efficient ways to store this incredible influx of data, they also have to be able to make sense of it. This is where business intelligence comes in. BI is a collection of applications and techniques that transform the raw, complex data of an organization into actionable information. Business can then use this information to make decisions that better serve and target their customers while also maximizing their cost savings.
Nucleus Research, a global provider of ROI-focused technology research and advisory services, found organizations earn an average of $10.66 for every dollar spent on deployments of BI, performance management and predictive analytics applications.
Companies are using BI to revolutionize their business operations and improve their revenue in many ways. In fact, according to Forbes, 89% of business leaders believe big data will revolutionize business operations in the same way the advent of the internet did.
There are countless ways businesses can deploy a BI solution. These solutions are helping businesses work smarter and in turn they are able to:
Increase sales performance
Thousands of retailers have improved their profit margins by being able to track sales data at the individual customer level. Getting down to this granular level of detail exposes trends and areas of opportunity.
Better manage their financials
BI solutions simplify financial data analysis by replacing cumbersome spreadsheets and financial statements with real-time analytics dashboards, charts and graphs.
Develop key performance indicators (KPIs)
BI tools help businesses establish metrics that come with key performance indicators, which are aligned with their overall business strategy. Based on these measurements of success, they can then use their resources more wisely and focus on improving performance where it truly matters.
Find the right marketing channels
BI can point businesses in the direction of new prospects by providing insights on the types of channels they are most likely to use, e.g. Facebook, Twitter or Instagram, and their physical location.
Gain a competitive advantage
Companies that use analytics are five times more likely to make decisions faster. BI makes the information businesses need easily accessible with the click of a button providing them with a competitive advantage over their market peers.
Each of these goals are driven by business intelligence analysts whose roles have become increasingly important as companies work to capitalize on their big data. A career in BI analytics requires a blend of hard skills, like programming and statistical analysis, in addition to soft skills, such as communications, problem-solving and analytical thinking. Having at least a bachelor’s degree in computer science, business, mathematics, economics, statistics, management or accounting is often required also. According to data gathered by GlassDoor, BI experts can earn upwards of $113,000 a year making a career in the field well worth the education and training necessary to be successful.
As we mentioned previously, business intelligence is not the same as data mining. Excelling as a BI expert requires you to understand how the two processes differ, but first, let’s go over what data mining actually entails.
What is Data Mining?
Data mining is the process of analyzing data to identify useful patterns and insights. The anomalies, patterns and correlations exposed in massive data sets through data mining are what lead to valuable business intelligence.
Businesses are reaping many benefits from the increased accuracy that data mining software tools have provided in recent years, including:
- Increased revenues
- Reduced costs
- Improved customer relationships
- Lower risks
Several different techniques are used by data scientists during the data mining process, these include:
Classification
This technique segments data into categories. It involves looking at data that has already been categorized and then applying rules based on machine learning from the existing categories to newly collected information.
Association
When a retail site suggests products to you based on your previous purchases, you’re seeing association in action. This process is used to identify patterns in data sets and determine the relationship that exists between them. Association then goes on to make predictions about future behavior based on those patterns.
Clustering
The clustering technique classifies data into segments. Clustering is an especially useful technique because it can spot small differences or similarities that may not be picked up by the human eye. As a result, you can create segments that are highly accurate.
Outlier Detection
Simply recognizing a general pattern in your data set will not always give you a clear understanding of it. You have to be able to identify anomalies or outliers. For example, if you see an influx of website traffic from a specific geographic location, you’ll want to investigate the spike and determine what drove it so you can get a better understanding of your audience.
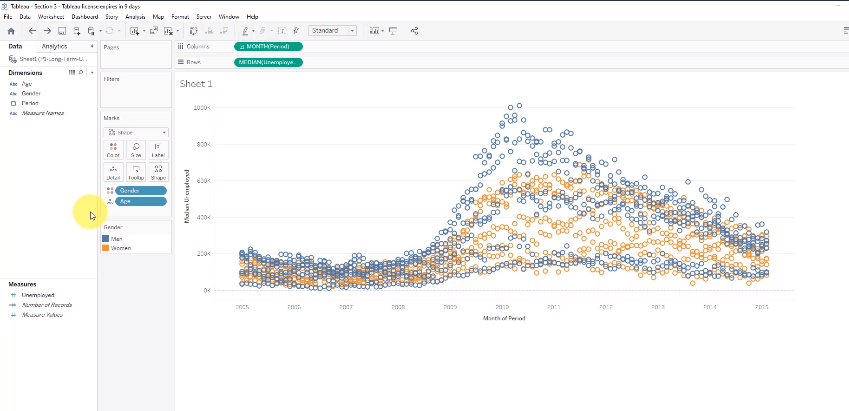
KNIME, R-Programming, Qlik and Tableau are just a few of the many tools used by businesses to perform data mining tasks. For instance, Tableau has several features like trend lines that allow users to make a trending analysis with just a few clicks. Users can also predict time series based on historical data with Tableau’s forecasting models. Market basket analysis can also be performed in Tableau which is a necessity for e-commerce businesses.
You can dive deeper into Tableau’s data mining capabilities with our hands-on Tableau training for data science. Through the online course, you will learn how to convert raw data into compelling visualizations and create opportunities for you or key decision-makers within your company to discover valuable data patterns.
Converting raw data into a usable format is one of the core functions of the data mining process. This crucial step can be tackled in a few ways:
What is Data Preparation?
Accurate and efficient business decisions can only be made with clean data. Clean data comes from good data preparation, which is the process of cleaning and transforming raw data prior to processing and analysis. We call this data preparation for data mining. Without this fundamental step in the data mining process, data can lack context and include bias. Poor data quality that goes undetected can result in customer dissatisfaction, increased operational costs and overall inefficient decision-making within a business.
Data preparation varies across different businesses but generally includes the following steps:
- Discovery: Finding the data, which often comes from an existing data catalog, that is best-suited for the business’s current needs.
- Assessment: Getting to know the data collected during the discovery phase and understanding which steps to take in order to make it useful.
- Data Cleansing: Refining data using techniques like standardization, deduplication and validation.
- Data Enrichment: Connecting data with external information to provide deeper insights.
- Storage and Delivery: Storing or sending the data through a third-party BI tool for processing and analysis.
Let’s dig a little deeper into one of the most important areas of the data preparation process.
Data Manipulation
In order to work with data in the way you need it, the data has to be organized and easy to read. This is where data manipulation comes into play. Effective data manipulation leads to:
- Consistency: Data taken from different sources won’t initially provide a unified view of the information you intend to work with. Keeping data in a consistent format allows it to be organized and easily accessible.
- Higher value data: When you can edit, delete or insert data into a database, your data becomes less static and starts working to your benefit.
- Projection: Data manipulation makes predictive analytics possible by allowing you to use historical data to make future projections. This is particularly helpful when it comes to finances.
- Removing unwanted data: Not all of the data you collect will be usable. Data manipulation can get rid of unnecessary or inaccurate data so you can focus on the information that actually matters.
Data Manipulation Language
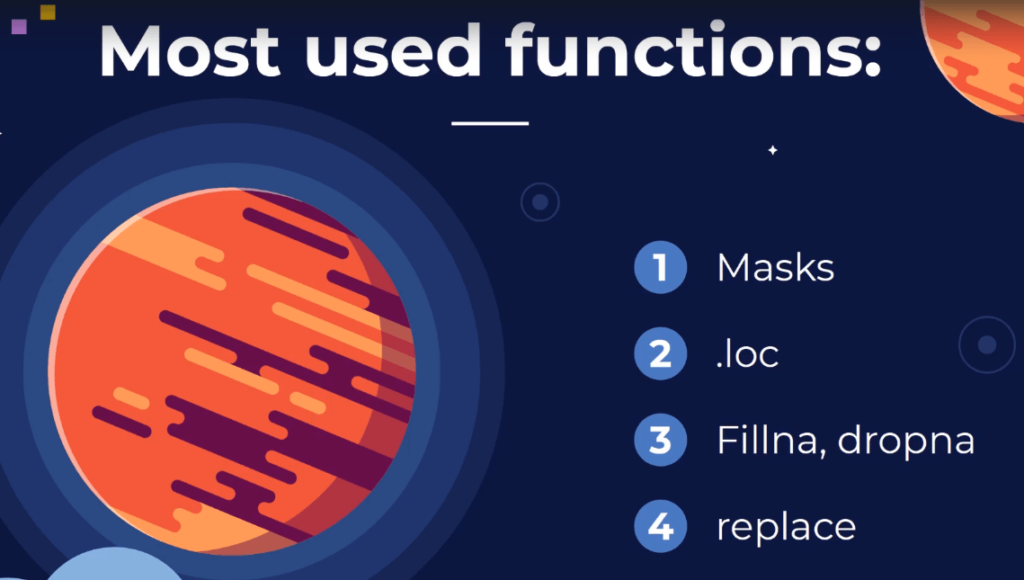
To manipulate data, businesses typically use data manipulation language (DML). DML is a computer programming language that can insert, delete and modify data in a database. The Pandas library within Python is one of the most popular tools for data manipulation. With the Pandas library, you can manipulate, transform, pivot, stack, merge and aggregate data to prepare it for visualization, statistical analysis or machine learning.
Our online Data Manipulation in Python course is a great resource for learning how to use these techniques efficiently. Data mining can be a lengthy process with data scientists reporting they spend upwards of 80% of their time on data preparation alone. However, the Pandas library makes it easier for data scientists to spend more time problem-solving and less time data wrangling.
Data Mining vs Business Intelligence
Now that you have gained a better understanding of the definitions of business intelligence and data mining as well as the techniques that comprise both processes, we can examine what makes them different and how they should work together.
Business intelligence and data mining differ in a few key ways, including:
- Data Volume: BI typically involves large volumes of data whereas data mining usually involves processing smaller amounts of data.
- Business Use: BI is used to gain insights that drive business decisions while data mining uses computational intelligence to find answers to specific questions or problems that contribute to decision-making.
- Results Presentation: BI results in dashboards and reports that provide a consolidated view of KPIs in graphs and charts. Data mining results in solutions being identified for particular issues which, in turn, create new KPIs for business intelligence.
- Techniques: BI techniques include data generation, aggregation, analysis and visualization while data mining involves cleansing, integrating, transformation and evaluating patterns in data.
When used in tandem, data mining business intelligence opens the door for businesses to gain a better understanding of their customers and the market in general. This understanding leads to better decision-making, more effective marketing strategies and increased financial gains.
Data Mining and Business Intelligence: How They Work Together
Data mining sets the stage for business intelligence processes to take place by allowing companies to find the information they need. Newly collected data is often raw and unstructured making it difficult to derive any valuable insights for the business. Data mining techniques, cleanse and decode data sets so analysts can follow up with business intelligence to make sense of why the information is important.
In addition, data mining leads to more dependable predictions about future outcomes. Businesses can go beyond their readily available historical data by analyzing past and present data to identify trends or patterns. Because data mining deals with smaller sets of data, businesses can get to the root cause of those trends and patterns. BI teams can then provide suggestions for how to capitalize on them.
An investment in data mining for business intelligence tools helps businesses retain a competitive advantage in the industries in which they operate. Being able to wrangle and interpret complex sets of data in an efficient and timely manner leads to streamlined business processes, greater customer satisfaction and greater returns on investment.