Data Science Tools 2020: The Complete List

If you are passionate about data science, you will find an endless list of tools useful for different stages of a project cycle. But are all data science tools effective?
Well, it depends! The astute data scientist knows the effectiveness of any tool depends on using the right tool for each project stage. And, for each step, some tools will perform better than others designed for the same purpose. So, to help you make the right choice, here is a complete list of effective data science software, including a brief on use, popularity, and pros and cons.
We have selected the most suitable software for the different aspects of a data science project cycle from the data science toolbox. Though the process includes acquisition, preparation, exploratory analysis, modeling, and visualizing, this article’s focus will start from preparation to visualization.
Acquisition involves the process of gathering and scraping data from multiple sources such as web servers, logs, APIs, and online repositories depending on the institution and the type of data generated. Preparation is the process of cleaning up and transforming the data ahead of modeling and visualization.
Exploratory data analysis identifies the variables or themes that will be used for model development. EDA uses tools such as SQL, Python, or other programming languages. Modeling entails producing descriptive diagram relationships from the data sets, while visualization is the graphical representation of the identified relationships.
In this article, you will find:
- Top 4 Data Preparation Tools
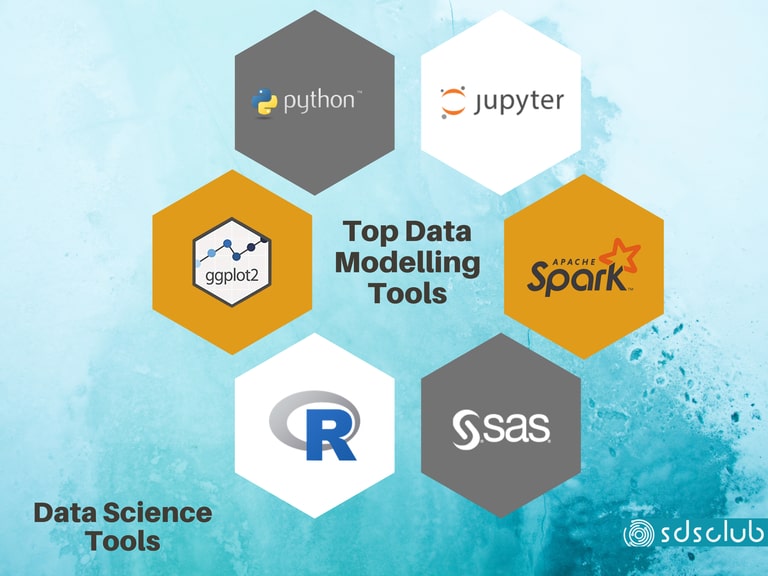
- The Leading 6 Data Modelling Tools
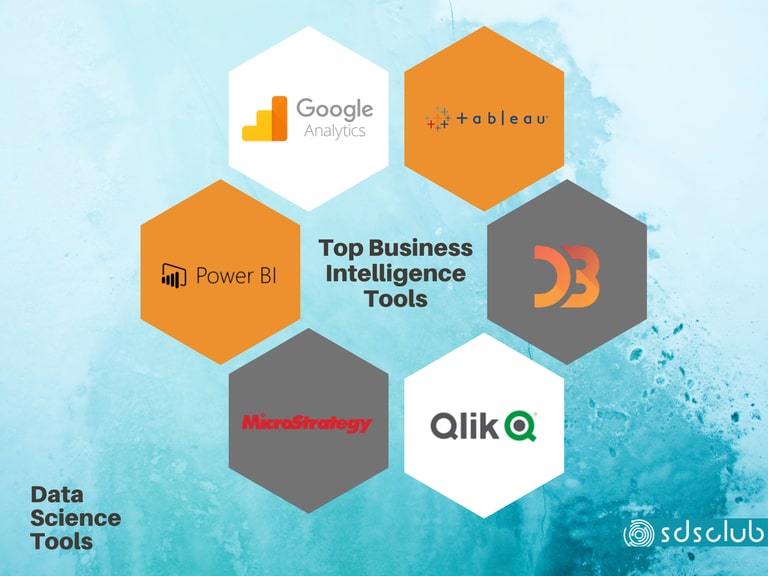
- Main 5 Data visualization or Business intelligence and Data Reporting tools
A Comprehensive List of the Best Data Science Tools 2020
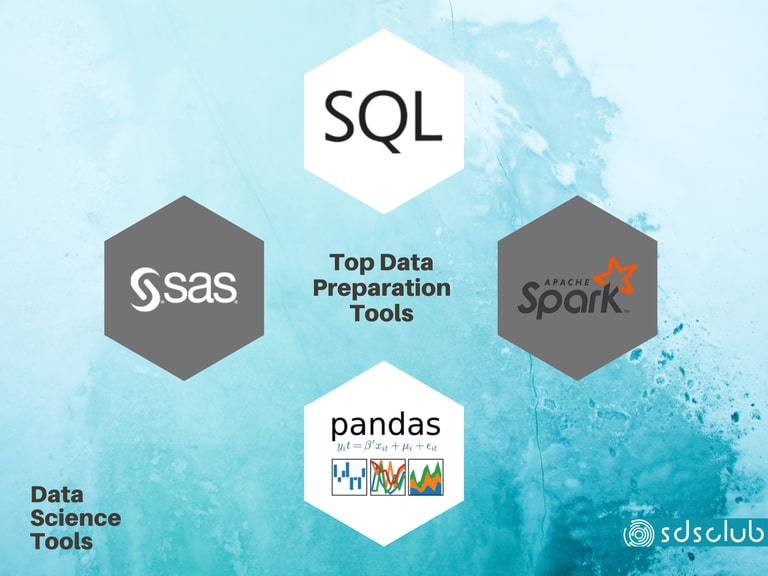
1. Top Data Preparation Tools
Data preparation involves cleaning and transforming raw data into a machine learning digestible format. Data cleaning is the most demanding aspect of a data science project cycle. It involves correcting corrupt and inaccurate sections of the data types, such as inconsistencies, misspelled attributes, missing or duplicate values, and combining data sets for deeper insights.

The components of data preparation systems include:
- Data ingestion capacity;
- Support for and capacity to integrate with a wide variety of data formats such as csv, .xml, among others;
- Data mapping, validation, cleansing, matching, reconciliation, and ETL.
The top data transformation tools for data science are-
- SQL
SQL is useful for cleaning or combining data sets that position you to draw richer insights from it.
However, SQL is not self-sufficient as a data transformation or manipulation tool for functions such as statistical analysis, regression tests, and time-series data manipulation.
- Pandas Python
Pandas is part of python’s data analysis library built for data analysis and manipulation. Panda is well suited for tabular data, collected using SQL, which it transforms.
2. The Leading 6 Data Modelling Tools (Machine Learning and Artificial Intelligence)
Data modeling is an iterative process, which entails presenting relationships between different types of data. Modeling is a framework for managing available data.
The process entails applying machine learning techniques such as logistic regression, support vector machines (SVM), Naïve Bayes, and decision tree to the data to identify the model that best fits the business requirement.

Data science software tools used for modeling include –
- Python
Python is an open-source programming language and is useful for data transformation and machine learning.
Its pros and cons are –
| Pros | Cons |
| It is free and open-source. | Low level of code reuse. |
| It has numerous libraries created and supported by a vibrant community. | People with no coding skills cannot test or develop ML models. |
| It is the most widely used programming language meaning it has high applicability to a wide range of uses and functions, including data transformation and machine learning. |
- Apache Spark
Spark is an open-source in-memory data analytics tool. It is used for data preparation and modeling. The tool is widely popular in the data science community due to its speed, ability to scale, and intuitive features, making it easy to use.
Apache’s pros and cons are –
| Pros | Cons |
| Highly robust processing big data at high speeds. | No automatic code optimization process. |
| Intuitive with easy to use APIs. | Lacks an inbuilt file management system and depends on other clouds-based solutions. |
| Dynamic and provides advanced analytics supporting machine learning, SQL, Graph algorithms, among others. | Not useful for multi-user requirements. |
| It is multilingual, integrating with Java, Python, and others. | Offers time-based window criteria and does not support record-based window criteria. |
- R
R is another programming language in the data scientist toolkit used for statistical modeling. There is a vibrant community using R, so it comes with an extensive list of libraries and packages to support machine learning tasks.
| Pros | Cons |
| It is open-source software. | Uses more memory as compared to Python and should not be used for processing big data. |
| Can run on all operating systems, including Windows, Linux, and Mac. | It cannot be embedded in web applications due to its lack of basic security features. |
| Useful for machine learning operations such as regression and classification and the development of artificial neural networks. | R language is very complicated and has a steep learning curve for beginners. |
| Provides quality plotting and graphing with the use of libraries such as ggplot2. | Does not support dynamic or 3D graphics. |
- SAS
Statistical Analytical System (SAS) is a programming language suitable for multivariate investigations, business intelligence, predictive analytics, data management, among other functions. SAS analyzes data sets to produce SQL queries, statistics, tables, reports, charts, and plots.
SAS is preferred over both R and Python.
| Pros | Cons |
| Simple to learn and debug. You can adapt to it even without a programming background | It is a closed domain, and access is dependent on the license type. |
| Powerful to deal with extensive databases able to manage vast volumes of data | Graphic representation options are inferior to R |
| Capacity to produce in-memory analytics which is time-sensitive |
- Jupyter Notebook
Jupyter is an open-source and is useful to create and share codes and documents. It is a data science software for developing code, testing it, and visualizing the data within its integrated development environment. It is useful for the complete data science workflow from cleaning, statistical modeling, modeling, and visualizing.
The software is also useful for exploratory data analysis. It allows you to test specific blocks of code within the project without executing the code from the start of the script.
You can run other languages such as R, Python, and SQL within the notebook. The main con of Jupyter notebooks is that the in-memory variables can be overwritten.
Some of the automated machine learning tools are –
3. Data Visualization or Business Intelligence and Data Reporting Tools
Business intelligence (BI) category of tools is the most widely-known software in the data science toolkit. They are useful for two things, to store and visualize data to help you understand trends and insights for strategic decision-making.
The insights are drawn from the compelling visuals representations of the data extracted using a BI tool. Bi tools often use a computation methodology called in-memory analytics, a system of understanding the computer RAM data as opposed to a physical storage disk.

Data visualization tools often have a low cost of implementation and require non-IT staff to implement. This characteristic makes them attractive for small companies since they do not need a full-stack business intelligence solution.
Data visualization and discovery tools like Tableau and QlikView, and Tibco Spotfire provide an intuitive approach to sift through large data forms and bring out insights through pictures and charts.
These tools help you achieve business growth objectives, collect data in one central place, and forecast future outcomes, among other benefits.
- Tableau
Tableau is one of the most popular business intelligence tools known for data analysis and interactive visualization of text and numbers. It easily integrates with multiple forms of data sources such as Excel, Online Analytical Processing (OLAP), MS SQL, Google Analytics, and Oracle.
Tableau has a free version for individuals called Tableau Public and a premium enterprise version. It has three main versions, tableau desktop, tableau prep builder, tableau server, and tableau online.
Pros and cons of Tableau are –
| Pros | Cons |
| Robust and reliable visualization performance. | It is not an industry standard for business intelligence tools as it is not possible to build informational tables with Tableau and extract extensive scale reports. |
| Mobile-friendly. | With recent versions of the software, you can roll back to previous versions, but rollback is impossible with older versions. |
| Low cost, easy to use, and upgrade. | The company has a poor reputation when it comes to after-sales support. If a user raises a performance issue, the customer support team does not follow-up to investigate and address the issue. |
| Supports a vibrant community of users who can learn and exchange ideas. | Tableau does not offer flexible value options for enterprise teams with varying needs. It provides a one size fits all pricing options, which may not accord to the different company needs. |
- QlikView
With QlikView, you can search, consolidate, visualize, and analyze all your data sources in a few clicks.
| Pros | Cons |
| It is agile and allows for team collaboration to make data-driven conversations and decisions owing to its real-time data sharing capability. | Requires SQL knowledge to develop applications and write script. |
| Simple and straightforward software that does not require a lot of maintenance. | Costly, you will be required to make extra purchases upon the base price to enjoy its full utility. |
| Offers multiple colorful data visualization options. These options help users categorize their data according to attributes, making drawing insights easy and without error. | Lacks intuitive features such as drag and drop common in other BI tools. And the interface is out of date. |
- Google Analytics
It is particularly useful for analyzing businesses’ digital advertising efforts. The tool is free and easy to learn and use.
| Pros | Cons |
| Provides insights on website activities. | Analytical data becomes available after 2-3 days. |
| Provides features for tracking paid Google Ads and Facebook Ads separately. | |
| Easy to set up and analyze conversion tracking data. | |
| Google Tag Manager makes adding GA tracking codes easier. |
- Power BI
Power BI is a cloud-based business intelligence service availed by Microsoft. It converts raw data into intuitive visualization and tables.
| Pros | Cons |
| It is highly affordable with a free desktop version and $9.99 per user per month for the premium version. | The complete Bi tools, including Gateways, Power BI Report Server, Power BI Services required for complex processes, are difficult for newbies to understand. |
| With Power BI, you can import data from a wide range of file types, including Excel, SQL, Azure, Google Analytics, Facebook, and other big data sources. | BI is not able to ingest data greater than 2 MB of data. Processing speed is slow or even hangs when processing millions of rows and columns of data. |
- D3.js
D3.js is a JavaScript library that enables its users to make interactive web browsers visuals. The tool is open source and allows users to recycle and customize past codes. It integrates smoothly with other web-based technologies such as HTML, SVG, and CSS. It has over 9,000 sessions on GitHub, meaning that many developers are working to improve the tool.
The disadvantage of D3.js is that it slows DOM manipulation for a large number of file entries and performance limitations for large quantities of SVG elements. There is a considerable learning curve with D3.js since it is in JavaScript.
- MicroStrategy
MicroStrategy is the last BI tool on this list. It has a user-friendly dashboard, with striking visualizations. It is intuitive with drag and drop features and easily adaptable to people with no programming background.
The main drawback with MicroStrategy is considered expensive for small businesses.
Final Reflections on the Data Science Toolkit
You are now pretty much off to a good start, with an in-depth understanding of the tools useful for the different stages of a project management cycle. Some tools cut across the various project cycle steps, such as Python and other programming languages, carry out a specific function.
Still, selection should depend on your level of experience with data science tools, the nature of your project, and lastly, your budget.
Sign Up to our newsletter to receive regular data science industry updates and news! Stay on Top with SDS club!


