Data Storytelling: Pro Tips and Hacks to Skyrocket Efficiency

In today’s world, data has become one of the most powerful resources ever known to the man. Although there are abundant amounts of data collected within organizations accounting to a substantial information value, most people lack the ability to exploit its full potential. Even with the availability of business intelligence tools and visualization tools, some organizations still struggle with producing value with any data they have. This is why we should practice the art of storytelling with data.
Why you need data storytelling
Storytelling is a powerful technique and it is all about conveying a story with theatrics, compelling narrative, and embellishment. Different cultures have their own ways of storytelling and therefore, storytelling often requires changing your delivery depending on the audience. That is the main approach behind capturing the audience and making a convincing case.
When it comes to story telling with data, it more or less is the same. Your data is your story and your visualizations are the theatrics. Embellishment comes from the hidden insight that you will accentuate as important. Simply, it is about converting a messy source of data into understandable chunks of verbally comprehensible sets of words. This practice of data driven storytelling allows your organization to utilize the power of storytelling and convey an idea to your team as well as clients easily and effectively.
Not only will data storytelling jumpstart a work ethic which is data-driven but also will help all of the stakeholders to have a better idea about what really happens within each department in spite of whether it is technical. Moreover, since it helps the involved employees as well as clients to understand what goes on, naturally it will initiate a culture where people with different specialties can converse, collaborate, share ideas, and nurture one common goal.
Key elements of a good data story and best practices to create it
The art of data storytelling can sometimes be a daunting task if one Is not familiar with the practice of storytelling. However, if the narrative as well as the delivery of the data story can be aligned based on the fact that data with stories are much more relatable to people than just raw data, it can naturally be an effortless task. Before you read further in this article, you might want to check this video on data storytelling. There are some good insights that we think you might be interested in.
It is always good practice to start with the basic elements of a story and work the way up. The following can be identified as the key elements of any good data story.
- Data
- Visualizations
- Narrative
It is the synergy and the proper fusion between these key elements that will bring out the best in any data story. Not only will they make the development of the story smoother but also will help the audience to easily understand the essence of the story you are trying to deliver. The following are a few concepts to be understood before planning the layout of any data story.
When visualization is performed on data, it makes the audience to easily grasp the insights which cannot be comprehended with just textual or numerical information. In other words, this is all about presenting the analyzed data using visual props, hence, we can say that it is data analysis storytelling.
The combination of data with a narrative will help your audience to easily understand the context of your data and why some insights are more important than others.
When visualization is combined with the narrative, it helps the audience to relate to and engage with the data.
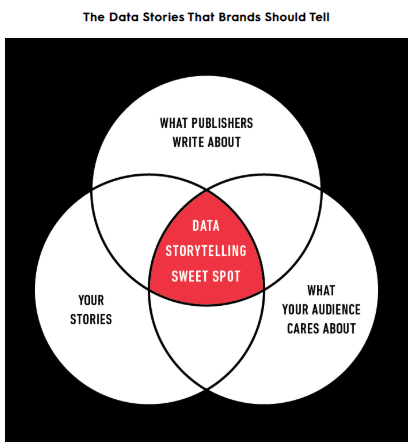
That is how the combination of key elements with one another will drive the art of data storytelling. While planning the layout, it is also important that you keep reminding yourself about what you can make out of the data you have depending on to whom you are trying to deliver the message. The following are a few of the most important questions to ask yourself that we think will help you to level the field with data storytelling much easily.
What is the data storyteller’s story
Every form of storytelling that has ever existed has always started with this question, what is the story. In data storytelling, the data you have will be the foundation behind the story you will share. Just like with any regular story, this data story also has to have a compelling narrative consisting of explication, rising action followed by the climax and the falling action, and finally the closing. However, if you cannot align and back your story with the data that you have, your story will collapse.
Therefore, it is always a good practice to think about what your story is and how it aligns with your data.
What is the data storyteller’s audience
This question should always be asked before you are about to present any story. Since it is data storytelling, your audience can mainly consist of two types of people; technical and non-technical. A majority of the technical people are more analytical than their non-technical counterparts. Therefore, they usually prefer to see information in numbers rather than just visualizations. This is totally opposite when it comes to non-technical people. They prefer to see less numbers but lots of visualizations.
Therefore, whether your story is inclined towards brevity or details always boils down to this question in order to make your story much more compelling, convincing, and effective.
What visualizations will be used
This is all about the theatrics of your delivery. There are thousands of ways to do storytelling with data visualization and yet, some techniques might not be as compatible as some are with your data. Moreover, depending on your previous question, the way you are going to present your data can have a big impact on how well the audience can relate to and feel your story.
Therefore, the kind of theatrics you use in your story will be a deciding factor on how effortless it can be for you as well as the audience to connect with data through the story. If you want to learn more about the power of visualizations, check out this video.
Thing to look out for in data storytelling
In spite of how proficient one might be with data storytelling, there still are a few risks that are involved. If done right, data storytelling will bridge the gap between you, the data, and the audience. However, if done wrong, data storytelling might have a negative impact on the audience while making them distant from both you and the data.

Tell a story with data without too many details
As you plan your layout, you might be carried away with all the data you are having and might feel compelled to use it all. However, it should be noted that overwhelming amounts of details can only bore the audience and lead to a negative effect.
Present relationships with right amount of visualizations
The more relationships you see with your data, you might want to visualize them in several ways to connect with your audience. However, you might be unintentionally overloading them with all the graphs and charts. Therefore, this is one thing to look out for when planning the layout of your story.
Give the right details without overlooking important insight
There could be lots of insight inside your data and sometimes, it might be necessarily for you to leave out some details that might feel unimportant. However, depending on your audience, there could be relatable insights to them that might play a huge factor in relating the story to them. Therefore, it is imperative that both these factors be considered at the planning stage.
Have space to engage with the audience
Data storytelling is not a one-sided engagement. Both the presenter as well as the audience has to engage with it for the whole stretch to be a success. Therefore, opening your story for feedback from the audience can have a huge impact on having a much bigger positive effect.
Provide data storytelling examples
Sometimes, the audience might not exactly have an idea about what you are trying to do with all the visualizations and narratives. Therefore, it is always good to open their eyes and let them know what you are doing. You can even provide some examples on very uncommon ways of telling a data story.
Examples of data storytelling
Data storytelling has been around us for a really long time and yet when we think about data storytelling, in our heads, we naturally visualize a person giving an audience a speech with some charts and diagrams on the projected display. This is because it has been embedded into ourselves deeply that a story has to be conveyed to a seated audience in a formal setting.
However, not necessarily storytelling has to take place as such. We will now go through a few of the real-life data storytelling examples that were hidden from us in plain sight.

Facebook is undoubtedly one of the giants in data storytelling. For a long time, they have been utilizing the power of data and information to make the user experience much better and optimized. The following are a few ways you may have come across the storytelling attempts of facebook.
- Number of different types of reactions you have had on your posts
- Celebrating friendship posts with a facebook friend of yours
- A personalized message on your timeline showing what you did exactly a year ago
These are just a few ways facebook is showing you the positivity you are spreading by engaging with the platform.
Spotify
Spotify is the giant in the music streaming industry and every year, they send you a list of songs that you have been listening to over the last 12 months of time. Not only has it a ring of positive nostalgia but also an appreciation of the impact you have made on the Spotify platform as a regular listener.
Uber
Uber is another platform that has petabytes of data about travels of their users. They usually send you emails about the number of miles you have been with them. However, instead of saying ‘you have travelled 1000 miles with us’, they would say something like ‘you have travelled 1000 miles with us and it is equivalent to 1000 journeys to the top of Everest and back’.
Conclusion
Telling a story with data is the perfect way to engage with your stakeholders, clients, or even users without boring them with overwhelming amounts of textual and numerical data. It can increase the engagements between people with different specialties across various disciplines. Not only will this open room for collaborative efforts, but will also increase the productivity, and efficiency of working towards a common goal.
If you are looking for more ways to learn about data, and data storytelling, subscribe to our newsletter. Please share this article on social media to spread the insight with your friends and colleagues. Stay on Top with SDSclub!


