How to Find Variance in R (Examples Included)

Even if you are new to Statistics or Data Science, you must have at least a brief knowledge about the variance. It is one of the most popular “measures of spread,” which is used to define how data points are varied from a particular data point. Variance is mainly used in descriptive statistics, statistical inference, hypothesis testing, the goodness of fit, and Monte Carlo sampling, etc.
You can calculate the variance manually. However, it will consume lots of our valuable time. So, with the help of technology, we can now easily calculate the variance using statistical software or different languages. R is one of the most commonly used languages for analytics. It consists of built-in functions to calculate the variance easily. In the following sections, we will cover how we find variance in R.
What is Variance?
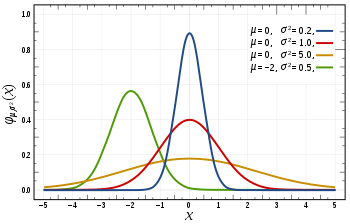
Before stepping into calculating variance using R, we need to have a basic understanding of the variance. Variance plays a significant role in Statistics. Simply said, it shows how data points in a data set are distributed among the mean values. When the variance becomes zero, all data points become identical.
Variance becomes higher when data points are spread widely around the mean value and themselves. On the other hand, variance becomes lesser if data points are narrowly distributed around the mean and themselves. Besides, it is important to note that the variance cannot have a negative value.
In the following section, we will discuss population variance vs sample variance.
Population Variance Vs Sample Variance
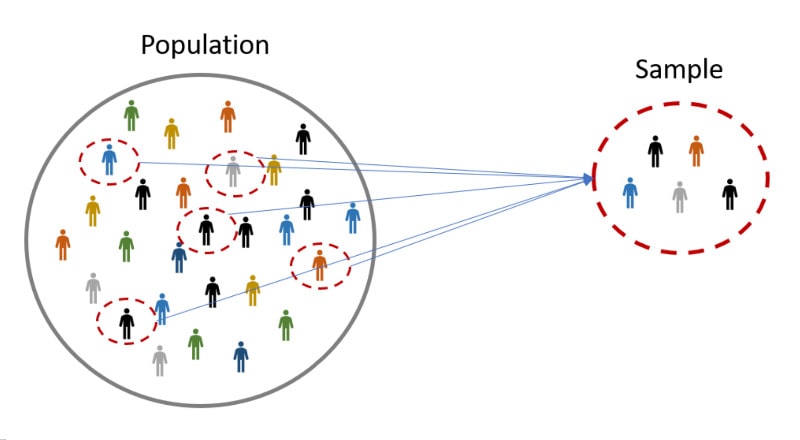
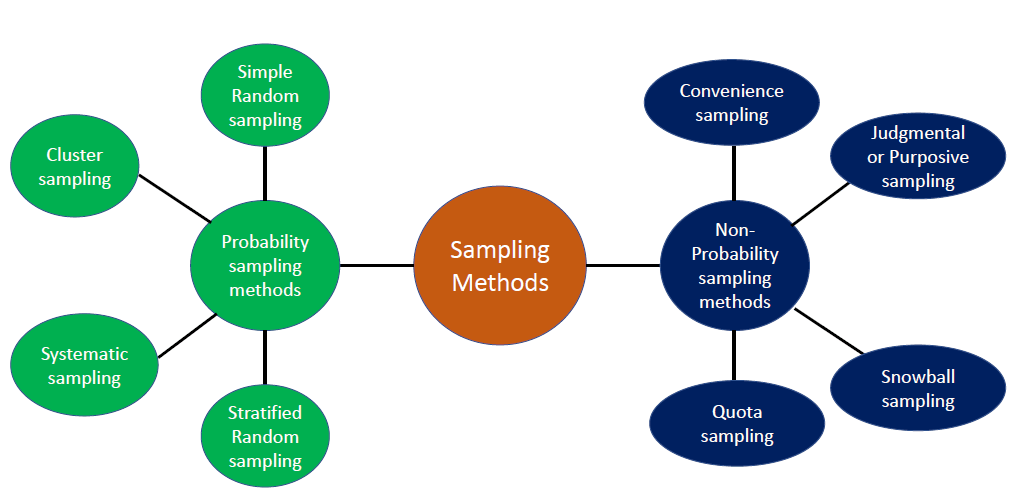
First, let’s learn about the population and sample SD. The population is the entire set of observations, while the sample is a subset of that population that is used to collect data for your analysis. The size of the sample is always smaller than the population. There are several methods of selecting a sample, such as Simple Random Sampling, Stratified Sampling, Clustered Sampling, etc. The following figure shows a set of sampling methods used in Statistics to obtain a proper sample.
For instance, the population may be all the people living in the USA, and the sample may be women who are divorced, more than 65 years old, or not having children among those who are living in the USA.
Population Variance
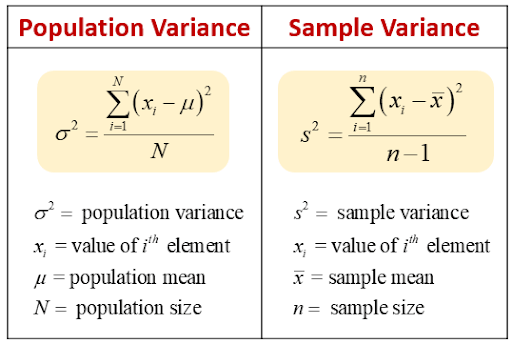
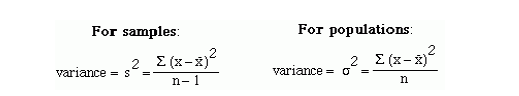
Population Variance is denoted as 2, and it indicates how data points are spread within a population. We can calculate it by getting the sum of the squared difference between observed values and the mean value and dividing it by the number of observations in the population. The following equation is used to calculate the Population Variance.
Sample Variance
Sample Variance defines how data points vary in a sample that is a subset of the population, and it is denoted by s2. To calculate Sample Variance, we have to get the sum of the squared difference between observed values and the sample mean and then divide it by the sample size minus one. For large samples, there is no need to use -1 in the denominator. You can just use n in those cases.
I hope you got a clear understanding of sample vs population variance by now. Next, we will move onto some popular usages of the variance.
Usage of Variance analysis
Investors use variance analysis to measure how much risk an investment carries and whether it will be profitable. Variance is also used to compare the relative performance of each asset in a portfolio to achieve the best asset allocation. It helps management to understand the current costs and thereby control future costs. Next, let’s learn how to calculate variance in R.

How to find variance in R
Now, let’s see how to calculate variance using R. There is a built-in function in R called var() to find the sample variance. Likewise, you can perform a simple calculation in R to find the population variance. We have discussed more details on finding the variance using R in the following section.
How to find sample variance in R
R uses the var() function to find the sample variance of a specific vector. The c() function in R can be used to combine a given set of values to form a vector or combine two vectors. So let’s create a vector and calculate the variance of that vector using the var() function. For that, define a variable in R called X and assign the created vector to it.
X <- c(2,7,7,4,5,1,3)
Next, calculate variance in R.
var(X)
5.47619
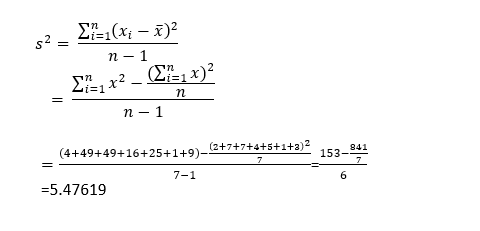
The following figure shows how to do it manually. As you can see, both methods provide the same output.
How to find population variance in R
Here, we use two approaches to find the population variance using R. In the first approach, we first define the data set and then calculate the length of that dataset, as shown below.
data <- c(2,4,4,7,8,12,14,15,19,22)
n <- length(data)
After that, we can calculate the population variance using the below formula.
var(data)*(n-1)/n
41.41
Here is the reason for the multiplication of (n-1)/n.
As you can notice in the above equations, the denominator of the sample variance is n-1. However, the denominator is n in the population variance. So, we can use the following simple calculation to retrieve the population variance from sample data.
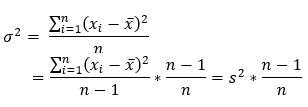
Since var() in R provides the sample variance, we can multiply var() with (n-1)/n to get the population variance.
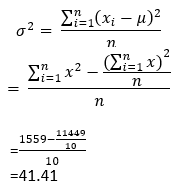
It will provide the same output as the following when calculated manually.
If you have to use the population variance many times in your work, this method may not be the best to handle it. Therefore, you can use the below approach in such situations.
In the second approach, we will define the data set using the c() function.
X <- c(2,7,7,4,5,1,3)
There, we will create a user-defined function with the function () keyword. We have to define the calculations in the body of our function to get the population variance. You can use any name for the argument rather than X inside the function () but have to use that name for calculations inside the function…
var_pop <- function(X) {
mean((X – mean(X))^2)
}
After that, we can call that user-defined function which is var_pop() in this instance by using a dataset named X. Here, var_pop() takes a numeric vector called X as an argument and returns the calculated value.
var_pop(X)
4.693878
Usually, the sample variance is smaller than the population variance. As a practice, we calculate the sample variance due to the small amount of data in a sample compared to the whole population. As a result, it will reduce the cost and time spent to find the variance.
Calculating sample variance of multiple columns
This method will be helpful when there are several variables in a dataset that you want to calculate the variance for each.
In this approach, first, we will create a data frame using data.frame() function in R. We can then execute the variable named “data” to get an idea about how the data looks like.
data <- data.frame(a=c(1, 2, 4, 5, 7, 9, 10, 12),
b=c(3, 5, 5, 6, 7, 8, 8, 16),
c=c(6, 7, 7, 9, 9, 11, 11, 14))
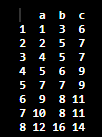
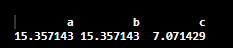
Then we can use the sapply() function to get the variance for each column in the data frame. sapply() function lets us iterate over a vector without using for loops.
sapply(data,var)
Calculate the Variance from Frequencies and Midpoints
We can calculate the estimated sample variance using simple R codes. The following steps will describe how to find it in detail.
First, let’s create some variables to hold the class interval midpoints of the data set and the frequencies of each class in the data set. Then we will assign them to variables named y and f, respectively.
y <- c(110,125,135,155)
f <- c(23, 15,6,2)
After that, we will calculate the arithmetic mean and store it in a variable called “ybar”. It is a must to use the above formula, even if you could calculate the arithmetic mean directly from the observations. If not, the estimated variance will become too large.
ybar <- sum(y*f)/sum(f)
Finally, we will calculate the estimated sample variance by using the below equation.
sum(f*(y-ybar)^2)/(sum(f)-1)
This estimated variance will depend on the midpoint selections and the number of class intervals.
Conclusion
We learned that there are two types of variance, called Population and Sample Variance. The var() function (variance function in R) is used to calculate both the sample variance and population variance. We also discussed another example where we calculated sample variance for multiple columns.
I hope you gained a better understanding of how to find variance in R and try to compute variance in R language using the above-mentioned methods. If you are seeking more ways to learn about statistical terms such as variance, subscribe to our newsletter. Feel free to share this article with your friends and colleagues to spread insight, and check out our blog for more interesting articles.