Top 10 Handy Visualization Apps for Business Analysts

We live in an era where data and information are very important. It is exactly this exposure to technology that led to the birth of many conspiracy theories around the world. It thus becomes increasingly important for all entities to share valid and scientific knowledge and data. This information should shed a light on many domains, help people take the appropriate decisions, gain knowledge and insights, and find opportunities. Data has immeasurable value, but not all data is so easy to understand.
Data firstly comes in a raw format that only if you have the knowledge and skills necessary, you can interpret. However, the goal of gathering more and more data is not accomplished without sharing the results.
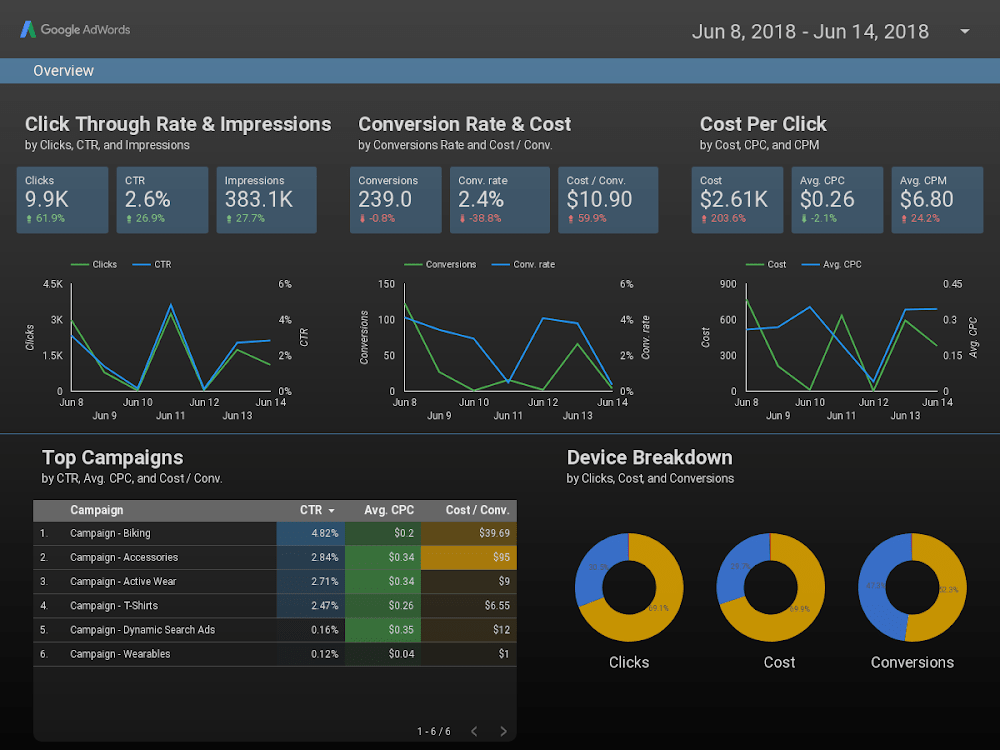
This is where data visualization comes in. It is about translating raw data into a more friendly format. This means that data is represented in the form of charts, infographics, or photos. Visual representation of data makes it easier to notice data patterns, data changes, and offer valuable insights to anyone who needs to make a decision.
Even though some might think that data visualization is a piece of cake, matching the right chart format with data is challenging. Not all data can be represented with the use of pie charts, for example. Thankfully, technology has developed tremendously over the last years and data visualization programs have been developed and improved.
Here we will present top data visualization tools that can help you save time, be efficient, and choose the best visual representation for your data. Even though they are mostly used for creating complex graphs, these tools can also be used to design your annual report, dashboards, marketing materials, and so on.
Main Visualization Apps
1. Tableau and Tableau Public
Tableau is one of the data visualization tools that offer DV specialists exactly what they need. It comes with a free version available on desktop and an online version as well. You have a huge library with different chart designs that can help you save time and choose the best one for you. Moreover, this visualization app is pretty intuitive to use. So, even though you do not have so much experience with data visualization apps, its drag and drop functionality leads to the best outcomes.
The app is also adapted to being used on mobile and you can share dashboards across your team. It is available both on Android and iOS, but mobile users say that the mobile version lacks many of the functionalities the web version has.
However, if you want to keep your data analysis private, you need to buy the Tableau Creator software, which is about 70$ per month for each user. These are the only cons of using this data visualization app.
2. SAP Business Objects Lumira – a data analytics app
SAP Business Objects Lumira is one of the tools that is widely used for data visualization. If you are using other SAP products, you should know that this one is well integrated with the other ones, so you do not need to sync the data or information.
SAP Business Objects Lumira is mostly used by companies that have a large amount of data. This might be the best visualizer app, as it has a huge library of charts and visual representations you can choose from to visualize your data. But the thing that is most impressive about it and it is a huge pro for using it, is that it automatically organizes your data. This means that you will save the time you have usually spent classifying data, and you only need to press a few buttons and everything is in place.
Among the cons of this data analysis app is that the free trial does not allow you to use all its functionalities. And the standard plan is 185$ per user, but it is a one-time payment. Among the pros of this app is that it is mobile supported and it works on all devices, from desktop to iPads, Android, and iOS.
3. Google Charts
Google Charts is one of those data visualization tools that is often overlooked by business analysts. It comes with a free version and a huge library of charts, maps, and infographics to choose from. Moreover, it is easier than ever to import data as it accepts many data sources, such as SQL databases, Google Spreadsheets, or Salesforce.
A big pro is that you can customize any chart just by using CSS, which makes your job even easier. One of the cons of using it is that the support you get on learning how to use it is limited, but you can find online some information and guidelines. Another con would be that it is not available for use on mobile.
4. FusionCharts – a data visualization app like no other
FusionCharts is one of the most powerful data visualization apps as it is based on JavaScript. This means that even those DV designers and specialists that do not have enough programming experience can use it. FusionCharts comes with 100+ interactive charts, from domain-specific charts such as Gantt Chart, Waterfall Charts, or Spider Charts, to popular choices such as bar charts, pie charts, or column charts. Moreover, they come with over 2000 data-driven maps that can help anyone nail data visualization.
A big pro of using this data visualization app is that it integrates most of the JavaScript libraries (Angular, React, jQuery), as well as other programming languages (Ruby, Java, PHP, Django).
However, one of the cons of FusionCharts is that it is pretty expensive, starting at 500$ per license.
5. Chart.js
If you are looking to create simple data visualization charts, then this JavaScript library is just for you. It is easy to use, open-source, and it helps you create visualization charts that are also mobile-friendly. Its cons are that the charts library is quite limited, having only eight types.
But it is free to use and easy to customize, so it may be what some business analysts are looking for. And as users have reviewed it, with a minimum of effort you can create some amazing and impactful charts.
6. ChartBlocks
ChartBlocks developers say that this data analytics app can import data from anywhere, including live feeds. However, even though you can do this, it is not as simple as they present it. You do not only need to do a few clicks, but more actions to manage to import data. It comes with a wide variety of charts that are responsive and easy to customize.
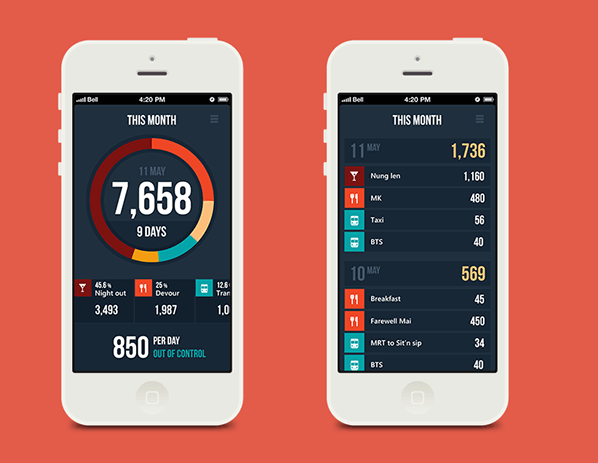
This makes it one of the big pros, as mobile data visualization is important because nowadays, most people use their smartphones for everything. The basic plan is free and the elite plan is 65$ per month. You have also other options in between you can choose, of 8$ and 20$ per month.
7. Infogram
Infogram is among those data visualization applications that are the easiest to use. Its simple drag-and-drop functionality allows even the most inexperienced business analysts to use it to create powerful charts. It also has an API that allows you to import data from any source easily and it comes with over 30 chart types and 500 map types. What you create with Infogram can easily be exported in all formats, from png to gif and HTML. Its con is that it doesn’t have a mobile app.
8. Datawrapper
Datawrapper is one of those visualization apps that was built specifically for news companies. If you frequent the websites of The New York Times or Boston Globe, you have probably noticed their charts. They are all built with Datawrapper, which also has a free plan for smaller news companies. You can easily import data and with a few clicks, you can create impressive charts that can be embedded in your website. However, if you want to have access to all its functionalities, it may be expensive; its plans start at 40$ per month. Datawrapper is also available on mobile, so it allows mobile data visualization and creation.
9. D3.js
D3.js is another JavaScript library that is usually used for handling data documents. To use it, you need programming knowledge, so this might be a con for business analysts that don’t have coding knowledge. You can choose from a wide variety of customizable charts and it is an open and free source.
10. Toucan Toco
Toucan Toco is among the android data visualization apps that are used widely by business analysts that do not have any coding knowledge. Many software products can be integrated with this data analytics app, such as Google Analytics, MailChimp, or NetSuite. You can create dashboards and predictive analytics, as well as data visualization with Toucan Toco. It comes with a 15-day trial and their prices are customizable depending on your needs.
Conclusion
If you are a business analyst looking for data visualization applications, you’ve come to the right place. These are the main visualization apps used by DV designers and business analysts that can help you build the most impressive charts. Do not forget to subscribe to our newsletter to not miss any news and updates on data visualization. And if you think more people need to find out about these, share this article with them.