Importance of Data Visualization According to the Experts

“There are so many different ways that you can visualize data. You can’t just put data into a bar chart or a line chart and think that it will solve everything. Each kind of dataset […] has visual forms that work better and that work less well.”
Nadieh Bremer, Freelance Data Visualization Designer & Artist
The trick to getting our non-techie clients to understand data is with compelling visuals. But as Nadieh says, it’s not enough to whack our data into a chart. If we want to create persuasive, actionable visuals, we need to learn the language of data visualization. But first of all, we need to answer what are the advantages of data visualization.
What is Data Visualization and Why is It Important
Visualization tells compelling short-stories
Ogo – who made over $200K in under a year as a freelance data consultant using visualization – says that colors keep things simple and help clients make decisions quickly.
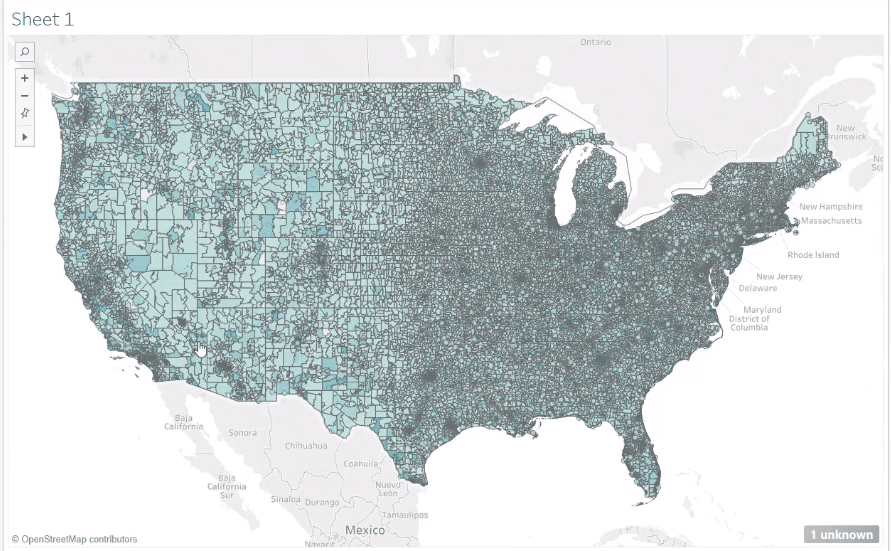
“Some companies I work with just put a bunch of worksheets on a page, and it can get confusing. It’s not telling a story. […] Being able to use color to quickly identify areas of opportunity so that the stakeholder can make informed decisions is essential in data science.”
Ogo Ezeofor, Power BI & Tableau Consultant, BlueLife AI
Visualization reminds our boss why we’re there
Jonathan says visuals are at the heart of every data science project.
“Visualization is a super powerful aspect of data science when it comes to communicating the results, which is really what [data science is] all about.”
Jonathan Mucha, Solutions Consultant, NS8 Inc
Visualization reveals data’s kernel of truth
Kirill has a poetic analogy to describe how data visualization works.
“When you’re visualizing, you are always reducing the amount of information you have. It’s like when sculptors work with marble. They start with this big block, and then they chip away at it. They’re always going to reduce the amount of material, to create the final piece.”
Kirill Eremenko, CEO, SuperDataScience
In the world of business, data visualization is one of the most sought-after skills to have, and it’s still underrated. With a suite of visualization programs now at our fingertips, anyone can become a top visualizer.
Visualization is one of five steps in the Data Science Process. Without it, our project is incomplete, and we leave our stakeholders hanging. When we learn the language of visualization, we give them the full picture.
* We took these quotations from our podcast series, “SuperDataScience Podcasts”. They have been edited for readability.