Start-To-Finish Guide to Contingency Table in R

What is a Contingency table in R?
This article aims to discuss the contingency table in R from start to finish. The contingency table, also known as cross-tabulation or crosstab, is a frequency distribution table that displays the relationship between two or more categorical variables.
Simply said, contingency tables reduce the size of observations to make maintaining tables easier. These contingency tables are used in different areas such as survey research and business intelligence. A contingency table that only contains one table is called a flat contingency table.
The resulting output of the contingency tables in R is more like a summary for a specific dataset. These data sets can be in any form, such as vectors, complex matrices, or data frames in R. The resulting table becomes more complex as the data becomes complex.
Now let’s see how to make a contingency table in R.
Creating a contingency table using vectors
Vectors are possibly the simplest form of data that can be used to create a simple contingency table. For instance, let’s create a vector called “vec” and execute the function table() on it.
vec<-c(1,5,3,8,5,2,6,1)
table(vec)

Here the table() function sorts the vector values and then prints the frequencies of every element in the vector.
We can retrieve an ordered set of data by using the sort() function and compare the result with the output of the table() function to verify it.
sort(vec)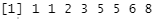
Creating a contingency table using data
Before moving onto more complex scenarios, we will first take a simple example. There is a data frame containing factor values and factors (factor variables) in two different columns. Let’s create a contingency table from those data using the table() function as shown below.
# create the data frame
df=data.frame(
"Name"=c("Ann","Susan","John","Lucas","Mike"),
"Size"=c("Large","Medium","Small","Small","Large")
)
# how to create a contingency table in R
C_Table=table(df)
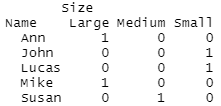
#how to read a contingency table
print(C_Table)
Now let’s move onto a bit complex situation. In this example, we use a data frame that contains data and two factors as columns. There, we have to use addmargins(), prop.table() and as.data.frame.matrix() functions in addition to the table() function to create the R contingency table. Simply, it returns the tabular results of categorical variables. Let’s jump into the below sample code.
install.packages("dplyr")
rm(list=ls())
library(dplyr)
Data <- data.frame(x = sample(LETTERS[1:10], 10, replace = TRUE),
y = sample(letters[1:10], 10, replace = TRUE))
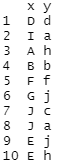
print.data.frame(Data)
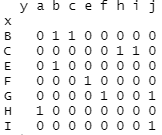
Then we will create a table using the following code.
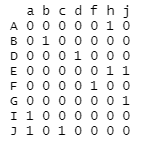
Table_1 <- table(Data$x, Data$y)
print.table(Table_1)
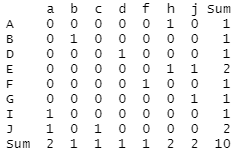
We can display row and column totals if needed.
Table_2 <- addmargins(Table_1)
print.table(Table_2)
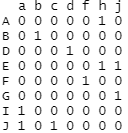
After that, we will convert it to a data frame using as.data.frame.matrix() function.
Table_3 <- as.data.frame.matrix(Table_1)
print.data.frame(Table_3)
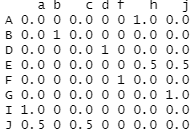
You can use the following code if you want to see the proportions based on rows.
Table_4 <- prop.table(Table_1, margin = 1) %>%
  as.data.frame.matrix()
print.data.frame(Table_4, digits = 2)
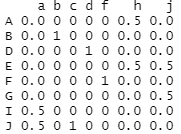
Or else we can display a table of proportions based on columns as follows.
Table_5 <- prop.table(Table_1, margin = 2) %>%
  as.data.frame.matrix()
print.data.frame(Table_5, digits = 2)
The table() function will remove the NA values. However, you can use the following code if you want to have them in the contingency table. We will use the tally() function in the dplyr library and the spread() function in the tidyr library to do it successfully.
install.packages("dplyr")
install.packages("tidyr")
rm(list = ls())
library(dplyr)
library(tidyr)
Data <- data.frame(C1 = c(rep("X", 2), "Y", rep("z", 5), NA, NA),
                   C2 = c(rep("p", 3), rep("q", 2), rep(NA, 4), "r"))
print.table(table(Data$C1, Data$C2))

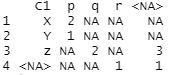
Then we will create the contingency table in R using tally() and spread() functions as shown below.
Table_C <-
  Data %>%
  group_by(C1, C2) %>%
  tally() %>%
  spread(key = C2, value = n)
print.data.frame(Table_C)
Creating custom contingency tables
We can also create contingency tables using a subset of the dataset, including only a few columns and rows. There are several ways to do that, and we will discuss them in the following sections.
By choosing Columns
We can create a contingency table in R using specific columns in a dataset. To perform that, we can use the table() function with the name of the vector object as the parameter.
df=data.frame(
  "Name"=c("Ann","Susan","John","Lucas","Mike","Ann"),
  "Size"=c("Large","Medium","Small","Small","Large","Large")
)
C_Table = table(df$Name)
# Or
C_Table = table(df[,1])
print(C_Table)
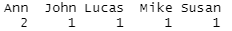
As you can see, the output contains name values that are alphabetically ordered and their corresponding frequencies.
By choosing Rows
We cannot create contingency tables by choosing specific rows, as discussed in the previous topic. This process is somewhat difficult and requires a matrix to create a contingency table by looking at the rows of the data frame.
df=data.frame(
  "Name"=c("Ann","Susan","John","Lucas","Mike","Ann"),
  "Size"=c("Large","Medium","Small","Small","Large","Large")
)
C_Table = table(as.matrix(df[2:3, ]))
print(C_Table)
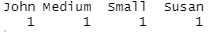
By rotating data frames
As the answer for how to create a contingency table using rotating, R uses the t() function, which refers to the transpose of data.
df=data.frame(
  "Name"=c("Ann","Susan","John","Lucas","Mike","Ann"),
  "Size"=c("Large","Medium","Small","Small","Large","Large")
)
new_df = t(df)

C_Table = table(new_df)
print(C_Table)

By using matrix objects
We can also create contingency tables using matrices that are two-dimensional data structures with a rectangular arrangement of rows and columns.
Matrix = matrix(
  c(1,2,3,4,5,6,1,2,3),
  nrow = 3,
  ncol = 3
)

C_Table = table(Matrix)
print(C_Table)

Hope you get a good understanding of how to make a contingency table in R. Now, let’s look at how to choose parts of an R table.
How to choose parts of an R table
Choosing parts of an R table is similar to the process of selecting parts of a matrix. Here, we will point out some commands that will be used to complete the above-mentioned process.
The str() command is used to display the structure of an R object which is similar to the summary() in R. It also shows the data type of each column while showing the first few rows and the total number of rows and columns.
The length() is used to show the number of items in a table.
Converting objects into tables
A table is a special data type that is similar to matrices. Under this topic, we will discuss how to convert a matrix and a data frame into a table.
How to convert a matrix into a table
We can easily convert a matrix into a table by passing the matrix into the as.table() command as following.
Matrix = matrix(
  c(1,2,3,4,5,6,1,2,3),
  nrow = 3,
  ncol = 3
)

New_Table = as.table(Matrix)
print(New_Table)

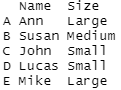
How to convert a data frame into a table
Here we will first convert a data frame into a matrix and then pass it to the as.table() command.
df=data.frame(
  "Name"=c("Ann","Susan","John","Lucas","Mike"),
  "Size"=c("Large","Medium","Small","Small","Large")
)
new_df = as.matrix(df)

New_Table = as.table(new_df)
print(New_Table)
Flat / complex contingency tables in R
In a flat table, several columns and rows are subdivided to create a single table. The ftable() command in R can be used to create flat contingency tables.
library(dplyr)
Data <- data.frame(x = sample(LETTERS[1:10], 10, replace = TRUE),
                   y = sample(letters[1:10], 10, replace = TRUE))

ftable(Data)
Cross-tabulation in R
We use cross-tabulation in R to show rows in a tabular format, and the xtabs() command is used to perform it.
table_t = xtabs(L ~ M + N, data = table1)
table_t
Here, L is the frequency of the data while M and N are categories. Plus (+) sign is used to cross-tabulate categories. R cannot identify variables if data objects are not used at the end.
Tests used with contingency tables
Finally, we will point out some tests used with contingency tables.
Chi-square test is used to check whether the row and column variables are independent. Additionally, we can use Fisher’s exact test and G test as alternatives. Yates’ correction is used in two way contingency tables that show counts of two categorical variables in which one represents rows and the other represents columns.
Conclusion
In this article, we discussed the contingency tables in R and how to create them using vectors and datasets. Furthermore, we learned how to create custom contingency tables.
Then we discussed how to choose parts of an R table and convert a matrix and a data frame into a table. Finally, we also had a look at flat contingency tables, cross-tabulation in R, and some tests with contingency tables.
If you are looking for more ways to learn statistical terms such as variance, subscribe to our newsletter. Feel free to share this article with your friends and colleagues to spread the insight, and also don’t forget to join our Udemy course to learn statistical methods in R quickly.